Data Science by Design (DSxD)
Last week I attended the Data Science by Design (DSxD) Creator Conference, which was incredible! During this conference, several of us decided to launch a new initiative to spark some additional creativity in our data science work. Introducing: #RecreationThursday!
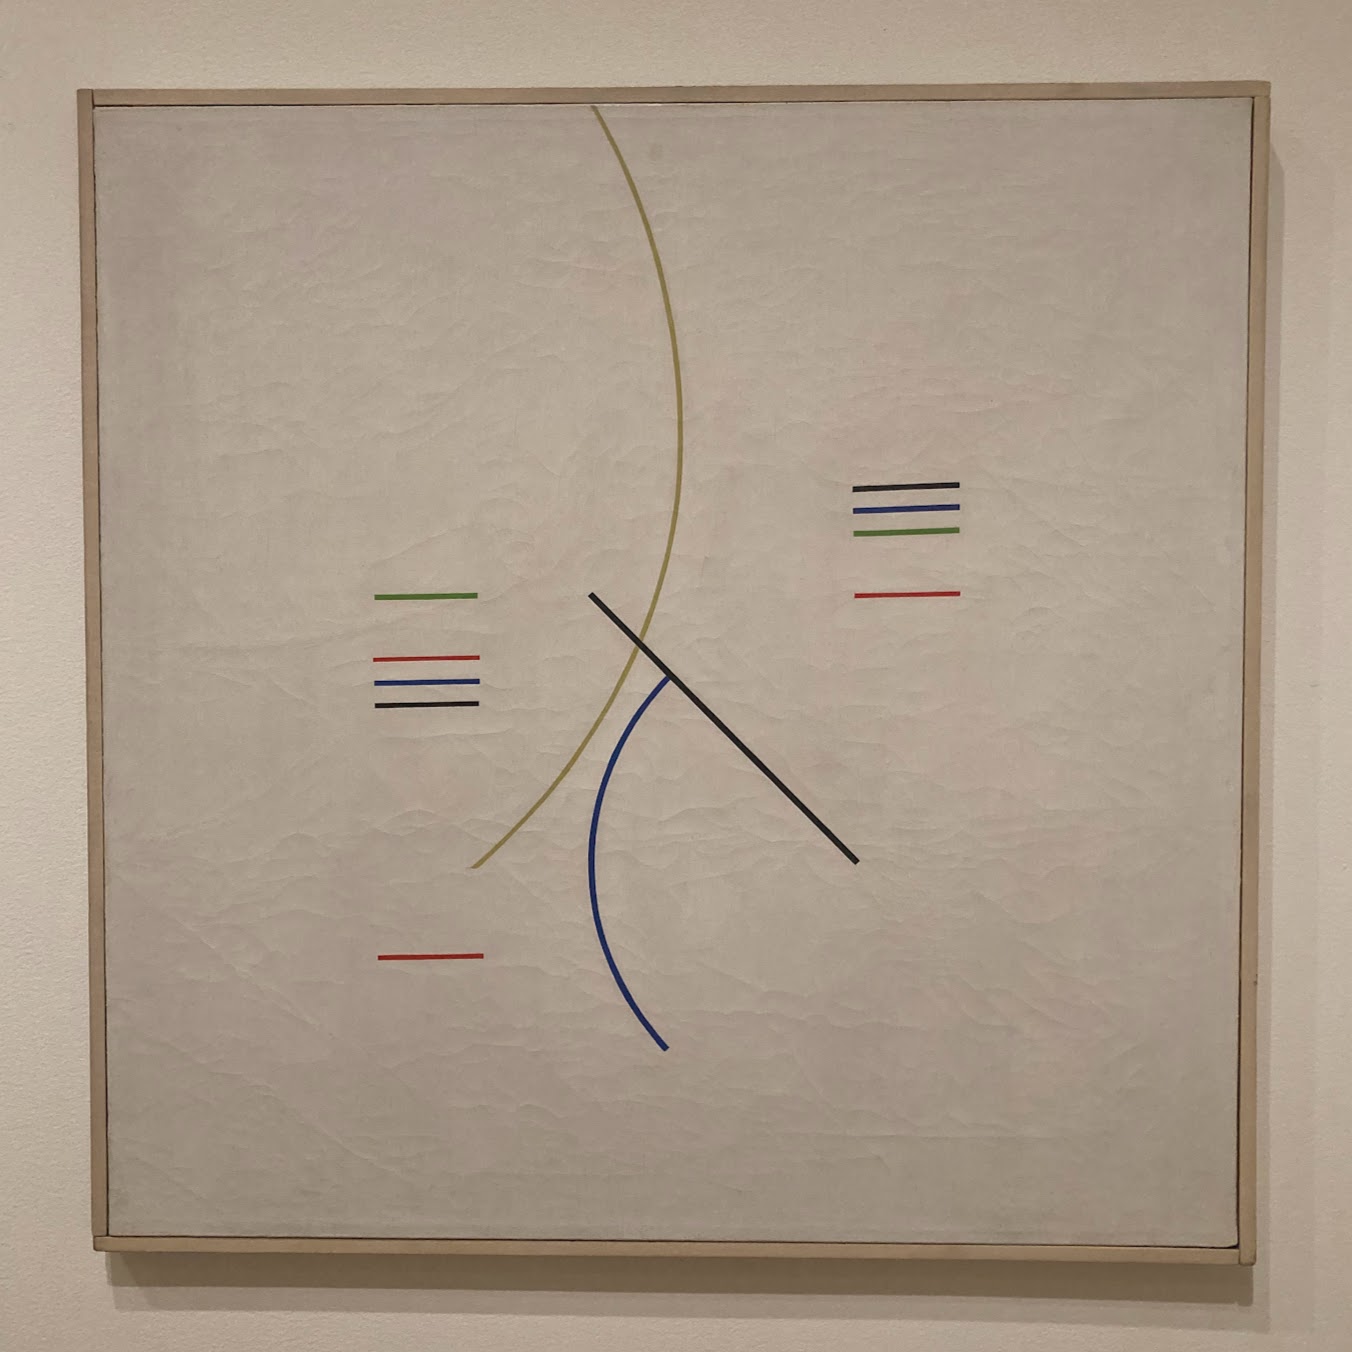
Every two weeks, we’ll be sharing an art piece for data viz folks to recreate/remix to get those creative juices flowing! Our first piece of inspiration is Alfredo Hlito’s Curves and Straight Series (1948) from the collection at MoMA in New York City. I actually dreamed up this idea for recreating modern art pieces with code during a recent visit there, so it’s fitting to start with one of my favorite pieces from that trip.
I’ve been trying (with little success) to learn some JavaScript this past year. While I love Daniel Schiffman and his Coding Train YouTube tutorials, I really needed a project to actually apply what I have been learning. I’m usually a pretty hardcore R nerd and ggplot2 stan, but I’d like to use this new initiative to delve into p5js… here we go!
We encourage you to include alt text with any recreations you share! Feel free to use the alt text from the image above to start off, and remix as you wish - maybe include details about your medium of choice, color differences or however inspiration strikes!
Hlito Remixed
Below is my recreation/remix of the original piece. Unsurprisingly, developing this gave me a much greater appreciation of the art work itself. For instance, getting that yellow curve just right involved making the circle it is based off of a little taller than it is wide. Mostly I just fiddled around until it looked right to me. After getting the overall structure of the piece down, I added some movement by playing around with the colors! This is what it looks like when you cycle through R, G, B values but maintain the original ratios between them from the original color value :D
// create the div that the figure will be rendered in
$('<div id="sketch" style="width:100%;"></div>').insertBefore(".mySketch");

// set up dynamic variables
let speeds = [2, 2, 2, 2, 2,
              2, 2, 2, 2, 2,
              2, 2, 2, 2, 2];
let color = [0, 0, 0, 0, 0,
             0, 0, 0, 0, 0,
             0, 0, 0, 0, 0];

// color modifying function
function lineColor(initial, index) {
  if (color[index] + initial > 255 || color[index] + initial < 0) {
    speeds[index] = speeds[index] * -1;
  }
  color[index] = color[index] + speeds[index];
  return initial + color[index];
}

// set up background canvas
setup = function setup() {
  // set canvas size and background color
  let canvas = createCanvas(950, 950);

  // move the canvas inside our <div>
  canvas.parent('sketch');
}

// draw shapes
draw = function draw() {
  // set background color
  background(227, 219, 205);

  // set line weights
  strokeWeight(5.5);
  noFill();

  // yellow curve
  stroke(lineColor(195, 0), lineColor(182, 5), lineColor(71, 10));
  arc(100, 250, 800, 900, -.75, 1);

  // blue curve and lines
  stroke(lineColor(3, 1), lineColor(70, 6), lineColor(162, 11));
  arc(715, 570, 500, 500, 2.4, 3.8);
  line(230, 420, 310, 420);
  line(700, 300, 780, 300);

  // green lines
  stroke(lineColor(107, 2), lineColor(163, 7), lineColor(23, 12));
  line(700, 320, 780, 320);
  line(230, 350, 310, 350);

  // red lines
  stroke(lineColor(214, 3), lineColor(47, 8), lineColor(25, 13));
  line(230, 400, 310, 400);
  line(230, 700, 310, 700);
  line(700, 370, 780, 370);

  // black lines
  stroke(lineColor(54, 4), lineColor(55, 9), lineColor(55, 14));
  line(450, 350, 690, 590);
  line(230, 440, 310, 440);
  line(700, 280, 780, 280);
}